If the Great Recession of 2008 taught us anything, it is that there is nowhere to hide during a stock market meltdown. This appears even more true in 2022. At least during the Great Recession cash held its value and purchasing power even as stocks tumbled, bonds and real estate collapsed, and commodities dropped. Today, inflation is eating away at the value of cash itself. It has lost at least 8%, maybe more. It takes at least $1.08 to buy what you could buy for a dollar last year. In a market environment such as this, how does an investor profit?
The strategies developed to respond to calamitous drops in the market are proving false. Modern Portfolio Theory, for example, is having its proposition that diversified asset classes are uncorrelated discredited. It is not always the case that when one asset class declines another increases. Sometimes, all asset classes sag.
We at AFC believe that history does not repeat, but it does rhyme. We can look back at the inflation of the 1960s and 1970s and see what worked then. We can apply those strategies. But just as important is to question what is different today and how we need to adapt.

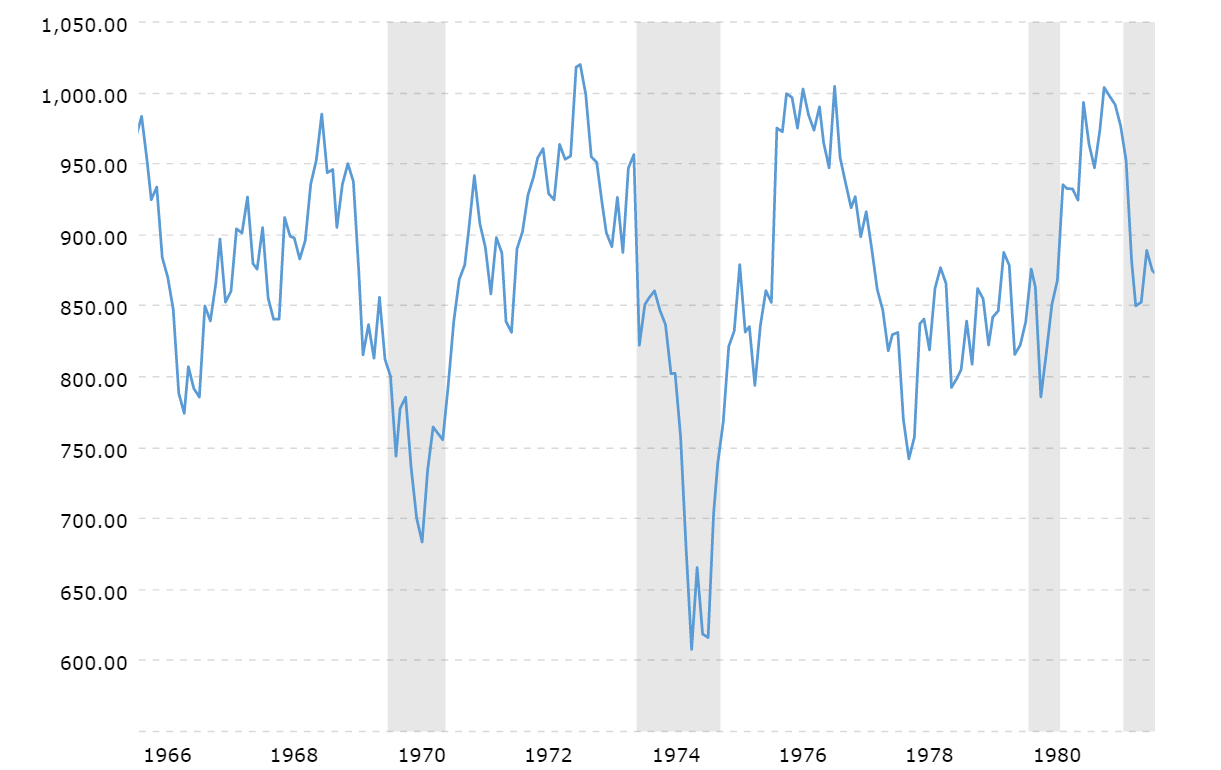
The chart above depicts the DOW between 1966 and 1981, the period of the Great Inflation. The DOW almost hit 1,000 in 1966 before falling 20%. It then recovered to nearly 1,000 a second time before falling 30%. The DOW peaked above 1,000 in 1972, only to plummet 40% over the course of 1973-74. By 1976, the DOW recovered to 1,000 again, and of course then proceeded to sag and hang down 20% for several years before rising to 1,000 in August 1982. In the decade to come, the DOW would soar to over 10,000.
The dollar from 1960 to 1980 lost 70% of its purchasing power. What that meant was, on the average, what cost $1 to buy in 1960 cost $3 to buy in 1980. In 1960, a first-class stamp was 4 cents, a Coke was 10 cents, a dozen eggs 57 cents, and a gallon of milk was 49 cents. By 1980 the first-class stamp was 15 cents, a Coke was 35 cents, a dozen eggs were 91 cents, and a gallon of milk was $2.16. Those portfolios sitting in cash had lost 70%.
What’s more important to understand is that the Consumer Price Index (CPI) grew six-fold from 1960 to 1992 (100 to 600). $100,000 invested in the Standard & Poor’s would have taken 32 years to equal that six-fold growth to $600,000. Index Funds did not exist during that time, but were they around it would have taken them 32 years to recover the loss in purchasing power caused by the Great Recession. Had there been an S&P 500 index fund in the 1960s/70s, it would have taken 32 years to break-even!!
As we face what might be a decade of rising inflation today, what lessons can we take from this period? For us at AFC, we see that there were individual stocks that did very well from 1966 to 1981. We seek to understand what those businesses had that gave them an edge over everyone else in the market.
$100,000 invested in McDonalds in 1966 would have grown ten-fold to $1 million by 1981. But who in 1966 really believed that a small drive-up restaurant selling 19 cent hamburgers would change the world of dining? Today, McDonalds is a household name. $100,000 invested in Arrow Electronics would have grown to over $2 million, but who would have believed a local store in Colorado which sold used radios in 1966 could expand to a billion-dollar major electrical components distribution business? But they realized the potential of the transistor and had achieved that status by 1981. Advanced Micro Devices dropped from $30 per share to $10 and then began to rise to over $300 (split adjusted) by 1981. Did it really matter whether a person bought at $30 or $10 when the stock continued to rise to $1,756 (split adjusted) by 1984? Some of the stocks that did very well had down-draws of over 70% in their early days.
I learned a very important lesson from that time. In full disclosure, I purchased Advanced Micro Devices in 1972 at close to its low of $10 per share. Within six months, I sold those shares for $30 and tripled my investment. For years, I patted myself on the back about how well I had done. When I licensed as a stockbroker, I looked back on that trade and realized I had made a huge mistake selling. Had I held that investment, those shares would have been worth $1,756 in 1984. Lesson learned, I realized that an ongoing analysis must occur. We at AFC now perform that ongoing analysis for each of the stocks in our client portfolios. We are not afraid to sell if there is a change in the analysis, but we do not sell if the analysis continues to get better.
We have realized that those investments that do well during difficult times are those able to adapt and respond to changes in technology, demographics, and lifestyles. We may be living in a time similar to the Great Inflation of the 1960s and 1970s. Those times were a stock picker’s market. There was no place to hide in a diversified stock portfolio, bonds, or cash. The exception was being invested in a limited number of the right stocks. That is what worked in the 1960s and ‘70s, and we believe it will work now.
We are long-term investors. We feel we have a winning strategy over the long-term and we want each of our clients to benefit. Where are you?
A. Michael Adams

