“Fisher taught Buffett not to overstress diversification. According to Fisher, investors have been misled, believing that putting their eggs in several baskets reduces risk. The disadvantage of purchasing too many stocks is that it becomes impossible to watch all the eggs in all the different baskets.”
–The Warren Buffett Way.
At Adams Financial Concepts most of our clients have lived through the Great Recession, the pandemic, and the beginning bout of inflation. We believe clients may well live through more traumatic tough market times. We believe having more money mitigates some or all of the impact of unplanned black swan events.
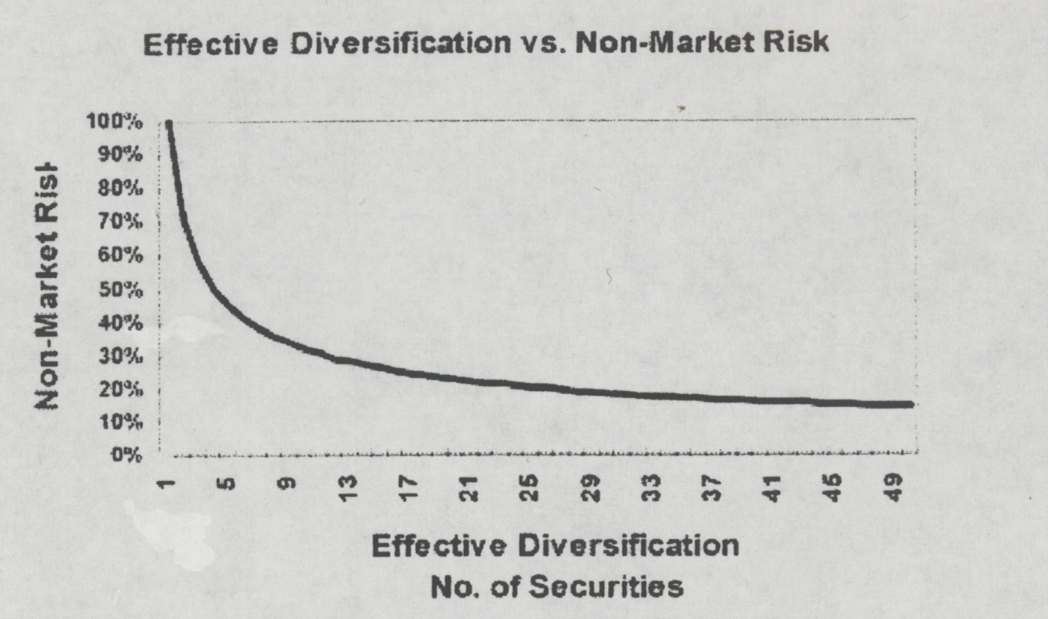
We seek superior performance based on three principles. The third principle is based on studies done by Evans and Archer1 and Sharpe2 that showed there is no significant difference in volatility risk for portfolios of 8-9 stocks as compared to 300 stocks. In other words, AFC subscribes to the Mark Twain philosophy of putting all our eggs in one basket and watching the basket.
We also understand there is a relationship between desired return and volatility risk. There is a rule of thumb that the fluctuation in an account is approximately equal to twice the hoped-for longer-term return plus the Fed funds rate.
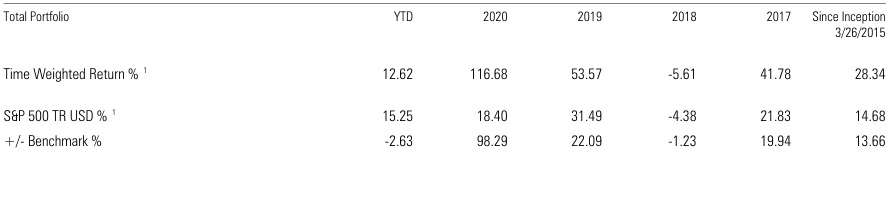
We illustrate this with an actual client account. The objective was to achieve about a 12% average return. From 2015 through the end of 2021 the client account grew from $153,000 to a net $306,000. Had the clients not taken withdrawals of $101,500 the account would have been over $407,000. The compounded return was 24.51% annually. The S&P 500 with dividends reinvested was less than 16% compounded annually.
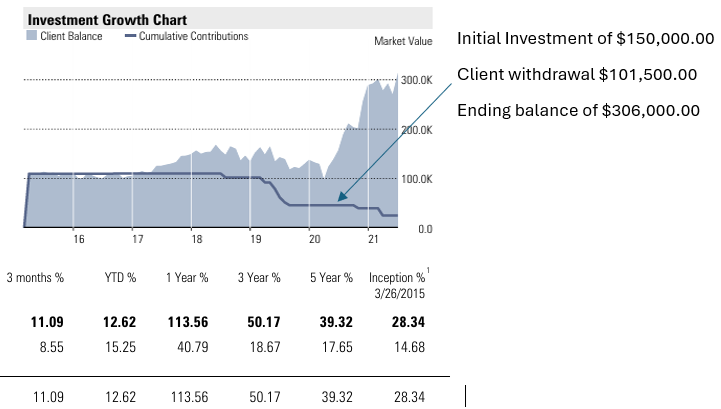
From late 2021 through the end of 2022 the account reversed. Adding the withdrawals the low point in the account would have been $174,435.
At the end of 2023 an annualized 12% compounded return would put the account at $290,044. If the account continues, will it reach that value? Only time will tell if the same strategy is applied.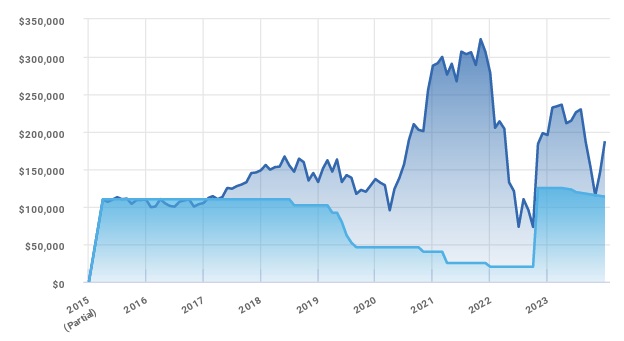
Even with the big swings consider this account at the low points has achieved a 7.40% compounded annualized return. Studies show that the average financial advisor is achieving a little more than 5%3,4,5,6,7,8,9,10,11,12,13,14. At the very lows the AFC client account was worth $48,000 more than the hypothetical average financial advisor’s equivalent account. That is 38% more compared to the low of the AFC client account with the hypothetical average financial advisor account.
There are a number of studies that show the relationship between expected returns and the volatility15,16,17,18. We use a rule of thumb that the volatility risk will be twice the expected return plus the treasury bill rate. In pictorial format the difference for an expected return of 5% and 12% can be shown in the graph below.
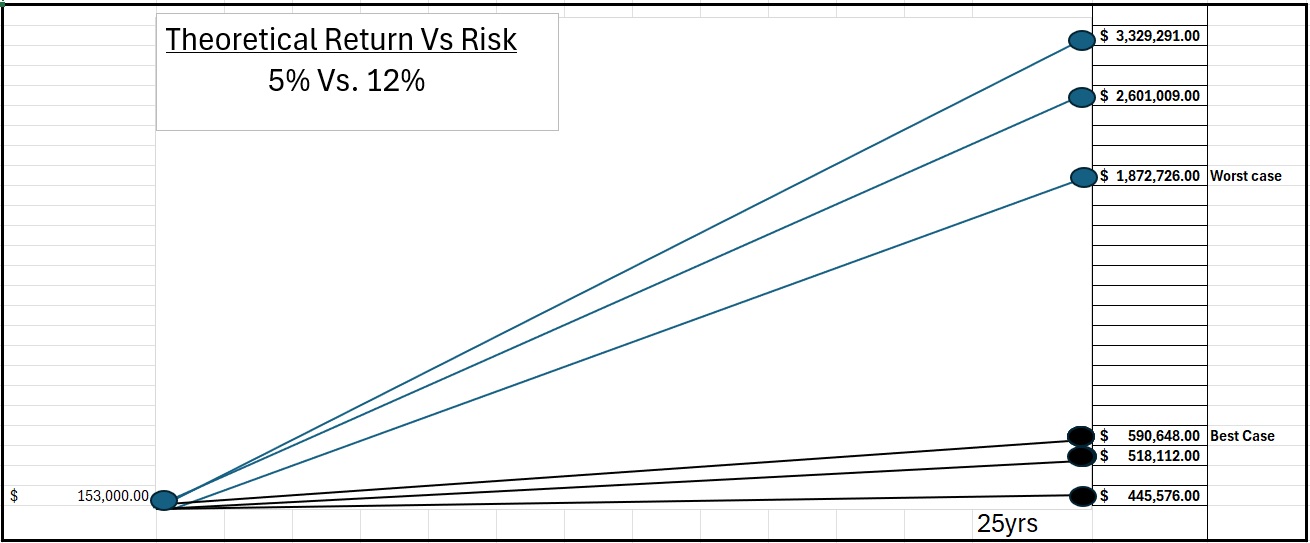
That is theoretical. But in my 38 years of experience, it seems like it has been validated in reality. The account illustrated above is less than 10 years under management at AFC but shows an account that swung from the higher curve to the lower curve. Will the account continue in the future. We cannot say for sure. No one has a crystal ball to see into the future. So, we have to say that past performance is no guarantee of future performance. But at least for the last nine years it seems to be verifying the theory.
At AFC we believe our clients are not seeking average or mediocre results. They have experienced black swan events. We believe our clients are searching for superior performance to mitigate the unplanned. We believe they want to minimize their taxes. We believe they want to maintain their quality of life for the remainder of their life. We believe they want to leave something for their heirs. We believe they want to make a difference in their community. If that describes you and you are not a client you should contact us.
Notes:
- Evans, J.L., and S.H. Archer (1968), Diversification and the reduction of dispersion: an empirical analysis, Journal of Finance, 23, 761-767.
- William F. Sharpe, “Risk, Market Sensitivity and Diversification,” in Financial Analysts Journal, 1972
The estimate for the average financial advisor producing just a 5% annualized return is based on these studies. The Cerulli Study covered 2010 and 2011. The SEI study covered 2015, 2016, 2017, and 2018. It is also based on the Think Advisor Magazine study for 2021.
- Coach Through Biases—Yours and Your Clients’”, John Anderson and J Womack, SEI, a leading global investment management for banks, trust and insurance companies, brokerage firms and financial advisors.
- Study Gives Advisors Bad Wrap, Jamieson, Dan, Investment News, September 9, 2012.
- 2021 RIA Survey & Ranking, Financial Advisor, July 2021
- 2022 RIA Survey & Ranking, Financial Advisor, July 2022
- 2023 RIA Survey & Ranking, Financial Advisor, July 2023
- 2016 Best Practices Workshop – Investment News
- 2019 Best Practices Growth Survey – Investment News
- 2020 Best Practices Growth Survey – Investment News
- 2020 FA Insight – TD Ameritrade
- 2021 Best Practices Growth Survey – Investment News
- 2022 Best Practices Growth Survey – Investment News
- 2023 Best Practices Growth Survey – Investment News
- The Cross-Section of Volatility and Expected Returns, Ang, Hodrick, Xing, Zhang, August 13, 2003
- A Step-by-Step Guide to The Black-Litterman Model, Idzorek, Zephyr Associates, July 20, 2004
- Continuous Jump Betas – Implications for Portfolio Diversification, Alexeev, Dungey, Yao, Econometrics, June 1, 2016
- Long-Term Expected Returns, Robeco, September 2020
