In 2012, Jackson National Life surveyed hundreds of financial advisors, asking them if their client accounts had done better than the S&P 500 TR. Fully 75% responded “yes they did.” Cerulli and Associates conducted a study on how well the advisors had actually done. Their clients achieved a 4.3% total return for those two years of 2010 and 2011. Compared to the S&P 500TR return of 17.75% and the 29% return for AFC clients. We believe if Jackson National conducted that survey today the findings would be the same. We also know that Think Advisor Magazine’s survey in revealed actual 2021 results similar to the Cerulli and Associates study.
It is not unusual for advisors to believe they did better when in fact, they were far behind. Studies show that when the question is asked in a room of several hundred, “how many drivers believe they are better than average?” 75% of the people believe they do. The vast majority of financial advisors do not publish how well they do for clients. But we can look at independent third-party studies that show how well they do.
At AFC, we publish the composite of client performance and compare them to the S&P 500 with dividends reinvested (S&P 500 TR). That is the most difficult index for which we can compare. Our goal for every stock account we open is to do better than the S&P 500 TR over the longer term (5 to 10 years). Only 1% of professional money managers can claim that and only 3% can claim to do as well over the longer-term. Our composite includes aggressive, moderate, and conservate accounts.
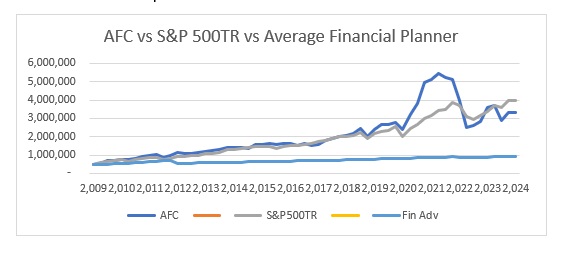
Since the bottom of the market in 2009 the composite of AFC clients has grown an initial $500,000 invest to $3,323,276 at the end of 2023 compared to the average financial advisor who grew their client accounts to $940,384. The AFC results are actual client account values net of all expenses and costs.
Our goal is to do better than the S&P 500 TR. We did not succeed in achieving our goal for the year ending in 2023. We believe we will in 2024. That is compared to the S&P 500 TR. It is not compared to the average financial advisor. For that we crushed the average financial advisor performance over that 13-year time period. Look at the graph to see how we compare.
| 12/31/2023 | AFC | S&P 500TR | Financial Advisors1 | ||
| Since Q1 2009 | 14.20 | 15.70 | 3.80 | ||
| 1 year | 17.00 | 26.30 | 6.80 | ||
| 2 years | (19.40) | 1.70 | 1.75 | ||
| 3 years | (12.50) | 10.00 | 2.72 | ||
| 5 years | 10.80 | 15.70 | 2.47 | ||
| 7 years | 8.50 | 12.30 | 2.82 | ||
| 10 years | 6.90 | 11.30 | 3.07 |
There is an analogy with baseball. The average season for all major league baseball teams is “81-81.” For every game played there is one winner and one loser. So the average is “81-81.” In the past 20 years, the Seattle Mariners have won 49% of their games – almost average. They have been above the 81 average 8 times and below 12 times.
Playing to be average is not what the players want nor is it what the fans want. They want the ultimate, the World Series.
I spent over 18 years in the national and regional brokerage houses. During that time there were two objectives emphasized: (1) Don’t lose money for your clients and (2) sell the relationship and not the performance. I believe the average financial advisor is very good at both. But is that really in the best interest of clients?
Don’t lose money for your clients sounds good. But there is a difference between actually losing money and understanding there are ups and downs. There are times when there are paper losses. But they are only realized when the securities are sold. Over the last several years the swings in the AFC accounts have been sharply up and sharply down. The swings are much greater but so has the performance, by a big margin.
Sell the relationship and not the performance is deadly, in our opinion. It says for the advisor to work to make the client like them to the point the client does not care about how poorly their accounts are doing.
Josh Brown who you may have seen on CNBC relates in his book Backstage Wall Street said this:
Most of the brokers [financial advisors] I know and have met over the years are phenomenal, world-class salespeople…But a great many of these security-selling savants don’t attain the knowledge necessary to actually accomplish anything for their clients… Selling one’s expertise is much easier than actually developing an expertise, especially as it pertains to investing.” (pg 65)”
At AFC we want to be the best at what we do. We are going to compare ourselves to the best (the S&P 500TR), not the average. At a time when a large portion of the population worries about running out of money we want our clients to know they will have enough their quality of life will not change. They will have enough to meet the unforeseen emergencies.
We know there are going to be times when there are unexpected losses, setbacks and calamitous drops. Seeking higher returns is going to mean higher ups and downs. We accept that. We believe that our clients are willing to accept wide swings in order to have significantly better results.
We now believe the worst times for this market cycle are probably behind us and we are optimistic our client accounts are going to bounce to new highs over the next year or so. Look at the chart and see what that means.
At a time when a large portion of the population worries about running out of money we want our clients to know they will have enough their quality of life will not change. They will have enough to meet the unforeseen emergencies.
Our clients at AFC are on the upper curve. If you are not our client you are very probably on the bottom curve. Is that where you want to be?
Past performance is no guarantee of future performance.
Footnotes:
- The values for Financial Advisors has to be stated as hypothetical. It is based on the Cerulli Study for 2010 and 2011. It is based on the SEI study for 2015, 2016, 2017, and 2018. It is also based on the Think Advisor Magazine study for 2021. Other years have been extrapolated from those studies and also from comments made at the Schwab Advisor Conference.
Disclaimers:
- Luck versus Skill in the Cross-Section of Mutual fund Returns, Eugene Fama and Kenneth French, The Journal of Finance, October 2010
- Goals Based Wealth Management, John Anderson and J Womack, Independent Advisor Solutions by SEI, September 2020
- Interactive Brokers Quarter 3, 2020 Form Q1
- Adams Financial Concepts (AFC) Managed Accounts results are net of all fees and expenses. The results are net, net, net.
- AFC Managed Accounts returns include all active accounts as well as all closed accounts with the same objective: to beat the S&P 500 over the longer-term (10 years).
- AFC Managed Accounts do not include the results of the Incentive Profit Sharing Accounts.
- The performance presented is that of actual client accounts and includes all equity Growth Accounts with one quarter or more. These are not hypothetical, models or back tested.
- Portfolios are concentrated in as few as 8 equities. Since William Sharpe received the Nobel Prize for showing there is no significant difference in volatility risk for portfolios of 8-9 stocks as compared to 300 stocks.
- AFC Managed Accounts include capital gains and losses, both realized and unrealized, but do not include the impact of taxes on capital gains.
- “I’m always fully invested. It’s a great feeling to be caught with your pants up” – Peter Lynch
- AFC accepts that there will be times when there will be periodic losses, setbacks, and unexpected occurrences. Calamitous drops do not scare us out of the market.
- Past performance is no guarantee of future returns.
- S&P 500 Index includes dividends reinvested
